
When most people think about marketing, they think about the cool commercials or punchy taglines. And indeed, most marketing wisdom is devoted to helping you develop creative campaigns or build digital assets.
But how do you know if all of those efforts are working for your business?
After all, marketing is part art, part science. You can create the most beautiful ad anyone has ever seen, but if it doesn’t perform well or reach your target audience, it’s a huge waste of time and money. For marketing to be successful, you have to focus on marketing analytics. In this blog we explain marketing analytics and describe how you can use them to improve your campaigns and grow your brand.
Table of Contents
What are Marketing Analytics?
Analytics in marketing refers to the process of collecting, analyzing, and interpreting data related to marketing activities and customer behavior.
To work on your brand’s analytics means you are using statistical techniques and special tools to see what’s working, what’s not, and what you should do about it to optimize your content and campaigns.
The specific metrics you are tracking will vary depending on the channels (website, email, social media, etc.) you’re using to reach your audience. You may be analyzing one campaign or post or you may be looking at marketing performance as a whole. Taken together, the data points will help you identify trends and patterns and make informed decisions to improve marketing ROI and overall business success.
Why Are Analytics Important?
Analytics are benchmarks that help you set realistic goals and evaluate your current marketing campaigns. But analytics can show you a lot of other things. Here are just a few reasons why marketing analytics are important to track.
- They improve lead generation. Analytics can uncover holes in your marketing funnel where potential leads are falling out. By tracking traffic to your website against actual conversions, you can analyze your marketing funnel to find out what’s broken.
- They identify trends. Measuring your analytics regularly can help you identify trends. Does your website traffic increase every time you post on social media? Is there a certain month you get more clicks on your Google Business Profile? By knowing these trends, you can take advantage of them and optimize the content that is working.
- They can find weak spots in the buyer’s journey. The goal of marketing is to meet your audience where they’re at in the buyer’s journey. You don’t want to hit them with “buy now” when they’re just warming up to you! Analytics can help you figure out weak spots in your funnel—like a CTA that’s too strong or emails that are too pushy.
- They help you identify messaging that reaches the right people. If your message is working, then your analytics will reflect that. If it’s not, your audience might be getting confused and no longer engaging with you. You can A/B test what messages work with what audiences, and boom—analytics can show you if it actually works.
Key Marketing Analytics to Track
Now that we’ve talked about why analytics are important, let’s break down which marketing analytics you should track for your next campaign.
Website
The pillar of many digital marketing strategies, your website is the central hub of your marketing efforts. It is the place where you will share the most content and where you will direct the most users. As such, website analytics are some of the most important to monitor.
Types of Website Analytics
Pageviews: Pageviews indicate the number of times your website pages have been viewed. This metric allows you to understand how much traffic your site is getting as a whole and which pages are most and least popular.
New Visitors: To understand how your marketing funnel is working, it is important to identify new users from returning ones. Tracking new visitors helps you know if you’re attracting fresh eyes to your website, giving you the potential for nurture or greater awareness activity.
Engagement Time: Engagement time measures how long visitors spend actively interacting with your website. It provides valuable insights into user interest and involvement, allowing you to identify which pages or sections of your website are capturing and retaining user attention.
Click Through Rate (CTR): This metric reveals the percentage of users who click on a specific link. By tracking CTR, you gain insights into how users interact with your site, helping you gauge the effectiveness of your calls-to-action and overall user experience.
Bounce Rate: Bounce rate reflects the percentage of visitors who leave your website without taking action. This percentage tells you how effective your site is. No one wants a lot of pageviews and no conversions. A bounce rate below 40% is generally considered favorable, as it indicates higher user engagement and longer on-site duration.
Traffic Sources: This metric reveals the origins of your website’s traffic. It tells you where users are coming from, whether through email links, social media platforms, advertisements, or search engine results. By leveraging UTM codes, you can delve deeper into granular details and accurately evaluate the performance of each traffic source.
How Often to Track Website Analytics
Knowing the importance of your website, it can be tempting to obsess over the data and make frequent changes. We strongly advise against this. Website analytics are best understood over a longer time horizon. We suggest taking a quick scan weekly just to identify any abnormalities or major issues but waiting until at least one month before making any large conclusions or changes.
This is because website analytics will naturally fluctuate. Some days of the week your site might be more popular or certain visitors may engage with your content differently than others. Since your website is connected to the rest of your marketing strategy, there are many factors that can influence performance (did you post a blog, mention something on social media, or follow up with a new lead?). Or your numbers may be due to something completely different (was it a holiday, a news story that increased awareness of your service, or a job seeker looking for employment?). The truth is that you simply cannot know all of the variables from one day or even a few days of data. Any conclusions drawn from this smaller sample size are likely to be wrong or misleading. If you rewrite content or rework your strategy based on these conclusions, you may end up spending a significant amount of time and money on efforts that don’t help your business and may even hurt it.
Instead, look for major patterns and trends over a month or quarter. Then once a year review your entire site for year-over-year changes.
Helpful Tools We Recommend
Google Analytics: A free platform from the biggest name on the internet, Google Analytics tracks and reports almost everything you want to know about your website.

Hotjar: A heatmapping program, Hotjar lets you see exactly how a visitor interacts with your site. It lets you see what parts of a page are the most interesting and indicates where users drop off.

Keywords
While a part of your website, keywords are important enough that they deserve specific attention. As we’ve covered in detail elsewhere, these are words or phrases that your site ranks for on Google and other search engines. This is critical for driving new traffic to your website and stocking the top of your marketing funnel.
Types of Keyword Analytics
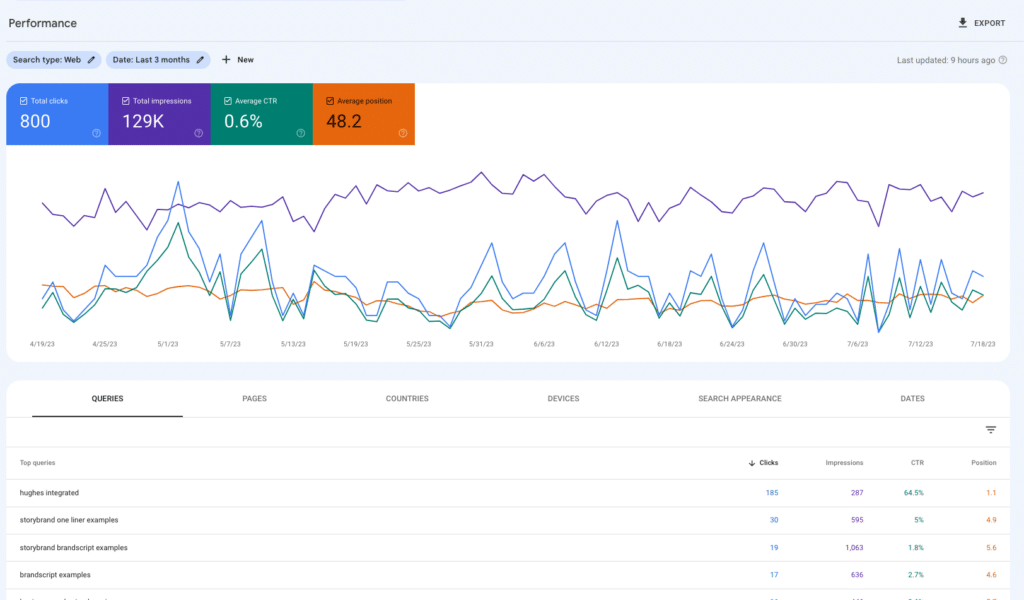
Search Terms: These keywords are the specific terms and their variations that someone needs to type into their search engine to see your site. You’ll want to know what keywords your site is ranking for (some are very important and others not) and how many keywords you are ranking for as a whole.
Search Ranking: Alongside each keyword, you’ll find a ranking. This is the position your website holds for that particular search term. (If you are 1st for “digital marketing”, that means you’re the top result someone sees when they search for that term.) The higher your ranking, the better since the first page of results gets 91.5% of Google traffic.
Search Volume: Volume is the number of people that search for a particular term on a monthly basis. When identifying target keywords, volume tells how many people are searching for something. The higher the volume, the more in-demand related content is.
Keyword Difficulty: Your site isn’t the only one out there and others are likely competing for the same search terms. Keyword difficulty shows you how challenging it will be to rank for a particular term. The lower the difficulty, the better chance you have of appearing at the top of the search results pages.
How Often to Track Keywords Analytics
While checking in from time to time is good, we recommend seriously looking at keyword analytics on a quarterly basis. It takes time (around 3 months) for search engines to properly index your page and begin putting you in the rankings. So even if you put together the most search engine-optimized page in the world, you won’t see traffic from it for a few months. This is very important to remember when setting accurate expectations for your website.
Helpful Tools We Recommend
SEMRush: SEMRush is a platform for keyword research and online ranking data. It includes all the metrics we mention above as well as many more. A subscription to SEMRush (or competitor Ahrefs) allows you to track your keyword ownership over time as well as research your competitors. This becomes very useful when putting together a blog strategy or website wireframe.

Google Search Console: This is a powerful web service that allows you to review the indexing status of your website, monitor search queries, and identify crawling errors. This data is important for making sure your website is search engine optimized.
Emails remain one of the best ways to develop a relationship with your target audience. Email analytics will show you the effectiveness of your communications.
Types of Email Analytics
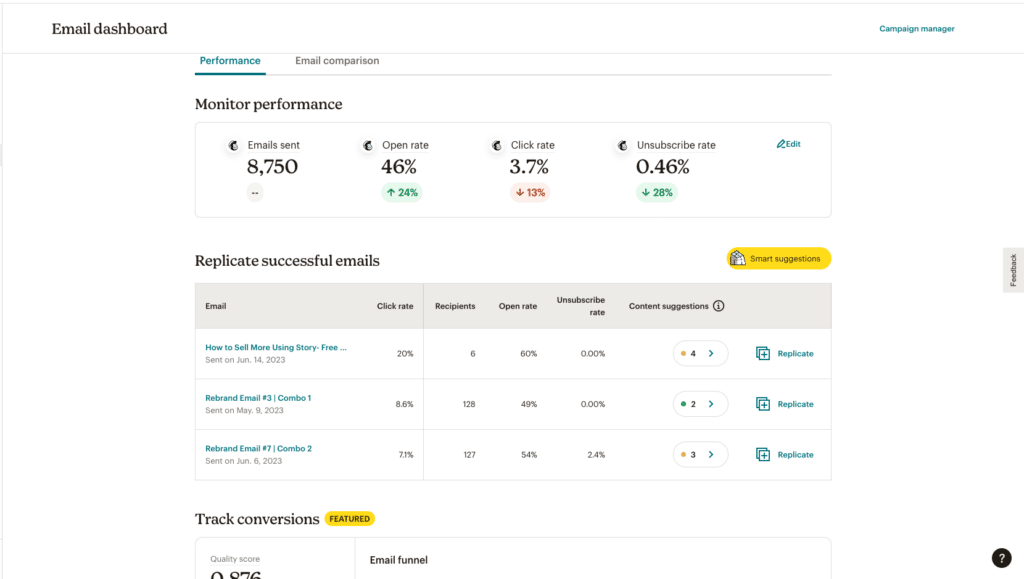
Open Rate: The open rate is the percentage of people (out of total recipients) who open your message. This shows you who is reading your content and suggests how well your subject lines are working. It may also indicate how interested your audience is in your brand.
Click Through Rate: The number of clicks/email opens x 100. This is the percentage of recipients who clicked one or more links in your email. Since the point of an email is generally to inspire action, click through rate suggests the effectiveness of your copy and CTA.
Conversion Rate: Conversion rate is the percentage of people who completed a desired action as a result of the email (schedule a call or download a lead gen).
Bounce Rate: An email bounce rate tells you how many of your emails were not successfully delivered. This may be because your contact’s information is not accurate or their account is no longer active.
Unsubscribe Rate: This is the percentage of people who ask to no longer receive email content from you. The law requires that you make it easy for an individual to unsubscribe. They may choose to do so because they’re no longer interested in your brand or for a whole host of reasons. If your unsubscribe rate is too high, you may be losing prospects because of something you’re sending.
List Growth Rate: An email list is all the subscribers you have in your CRM. The list growth rate tells you when you’re adding new contacts and expanding the reach of your communications.
How Often to Track Analytics
Compared to other marketing channels, email provides same-day results. Most messages will be opened and read within a few days of sending, so you can quickly see if your audience engaged with your most recent communication. Use this to your advantage to quickly test out copy or gauge interest in an offer. If your message is part of an email campaign, looking at this data as soon as it comes in allows you to optimize further messages.
We recommend reviewing email trends on a monthly or quarterly basis, depending on how many messages you send. This gives you an opportunity to see what types of subject lines get the best open rates and what types of email content lead to the greatest conversions. Identifying these trends will tell you a lot about how your audience wants to hear from you.
Helpful Tools We Recommend
Mailchimp: There are many CRMs out there and each has its pros and cons. Our team has found Mailchimp is the best for most businesses looking to increase their email marketing. It has an easy-to-use interface and a number of helpful tools to optimize your campaigns. Plus, it is generally one of the most cost-efficient options until your list reaches a certain size or level of complexity.
Social Media
If you are looking to foster relationships with your audience, you’ve likely considered your presence on a social networking site. Each platform has its own uniques (we’ve covered these in-depth here) but there are a few general metrics you want to be aware of.
Types of Social Media Analytics
Engagement: Engagement includes everything from “hearting” a tweet to clicking the thumbs up on a YouTube video. While the exact reason someone likes your content will vary, engagement generally signals that they are interested in or appreciate what you have posted. Engagement is a good indicator that your content is resonating.
Impressions: Most platforms will tell you how many users saw your post, and whether they took any action or not. The number of impressions suggests the visibility of your content and indicates your potential brand reach.
Comments: Motivated users will leave comments on your post. The content of their reaction will tell you what they think (positive or negative), but in general, comments mean engagement and help signal that a platform should share your post with more people.
Followers: Followers or subscribers are the number of people that have elected to see your content on a regular basis. They are notified whenever you make a post and are generally the people that make up your audience. The more followers you have, the more people interact with your brand.
How Often to Track Analytics
The frequency with which you look at your social media analytics depends on your brand’s activity. If you post a lot, you’ll have more information to check on a weekly basis. If you post sparingly, it’s not worth micromanaging every number until you can see the bigger trends. We suggest that anytime you make a post you keep an eye on the level of engagement. The data can quickly tell you what is working and what is falling flat. But since every post has a number of factors to it (subject, creative content, timing, wording, length, etc.) look for consistent patterns before drawing major conclusions. (The one exception is comments. It’s best to respond to comments on your content as soon as possible. This keeps the dialogue going and increases trust in your brand.)
Helpful Tools We Recommend
Social Media Platforms: For most businesses, the tools that they need to track their social media performance will be found right within the platform or in a related program. For example, Facebook and Instagram can be tracked through the Meta Business Suite. These platforms make it easy to track your business account without paying for an extra program or service.
Making Sense of Your Analytics
As you can see, there are many metrics you can use to track your marketing performance. So many in fact, that it would take many pages to give an adequate explanation of each. The most important information we can give you in this article though, is how to approach analytics in terms of your marketing strategy.
1. Consider Your Bigger Strategy
Any metric is part of a bigger story. Is it the one you want your marketing to be telling?
The metrics you emphasize should depend on your industry, audience, and goals. For example, if your issue is that people aren’t aware of your business, metrics like pageviews and social engagement should be a major focus. Increasing these will help fill the top of your marketing funnel. However, if you want to grow your quality of leads, focus more on engagement time, click rates, and the like. This will show you that those that are interacting with your content (even if they’re a smaller group) are the right people.
The metrics that you care about most should be the ones that tell you if your marketing is doing what you want it to.
2. Never Look At an Isolated Metric
It can be tempting to look at one metric and run with an interpretation. However, most metrics exist in an interconnected web. To accurately understand one thread, you have to look at the analytics around it.
For example, say you just posted on Facebook with a link to your website. As a result, you see a large increase in page views. However, your site’s engagement time and conversion rates drop dramatically. In fact, your bounce rate jumps higher than you’ve seen it in a while. Was your Facebook post effective? Yes and no. While you got traffic to your site (increasing brand awareness), none of those visitors are currently growing your business. This could signal many things but certainly does not suggest a raging success for your brand.
3. Take Your Time Before Making Major Changes
It’s true, data does not lie. But, data can tell a very complicated story. As we’ve suggested above, making snap decisions just because a number is down (or up) can set your business up for failure.
We recommend thoroughly analyzing a metric before adjusting copy, design, or strategy. If you have a hypothesis (“this action will make this metric better”), consider A/B testing. This will confirm or disprove your conclusions before you commit your entire brand to a change.
Best of all, we suggest having a team of professional marketers look through your analytics and recommend changes. You want someone with a trained eye to help you make sense of the numbers and get the best ROI for your business.
Feeling Lost in a Sea of Analytics?
If the information in this article feels intimidating, we get it. In this digital age, there is so much to track, analyze, and optimize. Doing so well can be a huge boon to your brand, but we’re not suggesting it’s easy.
In fact, that’s where many discerning brands choose to bring our team on. We have both the experience and the capacity to take a deep dive into your analytics and come out the other side with accurate, useful information. Anytime we work with a client we include regular analytic reviews as part of our commitment to own our results and grow your brand.
If you want to learn about the difference a team of digital strategists can make in your marketing analytics, schedule a free consultation with us. We’d love to share how we can get your numbers where you want them.
